Sites - Rede C2
Permanent plots and environmental gradients across Caatinga and Cerrado
Sites & gradients
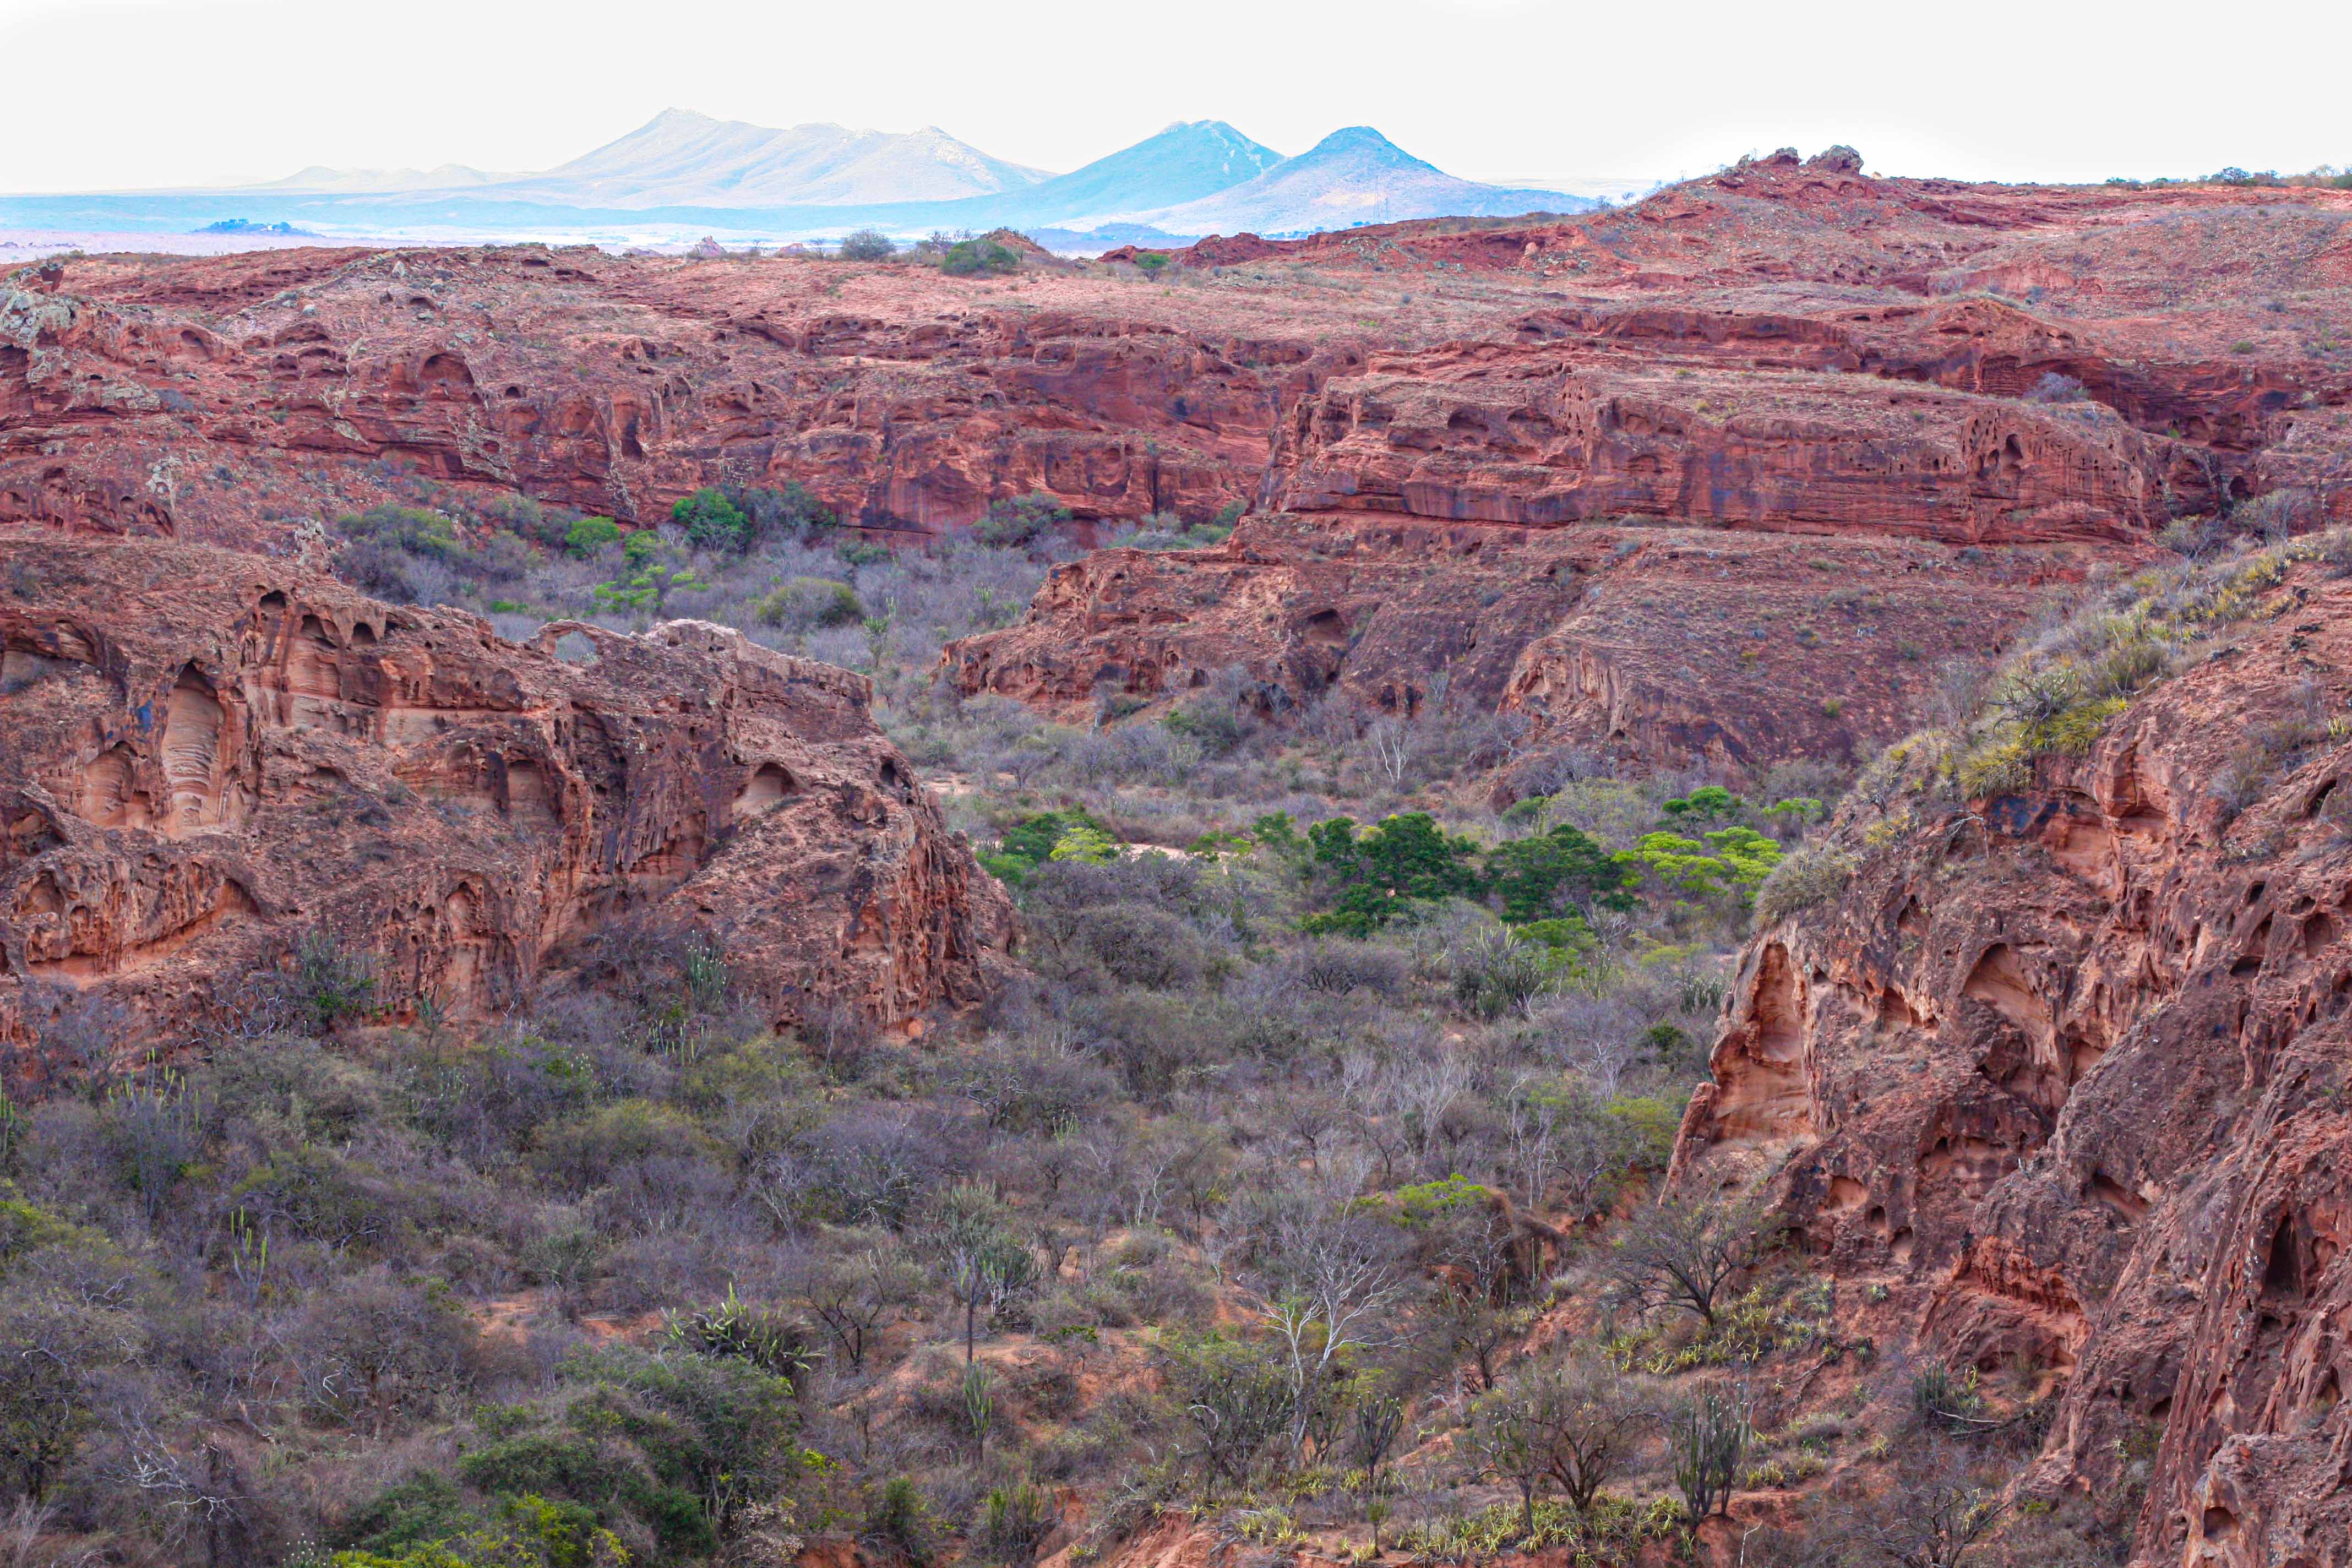
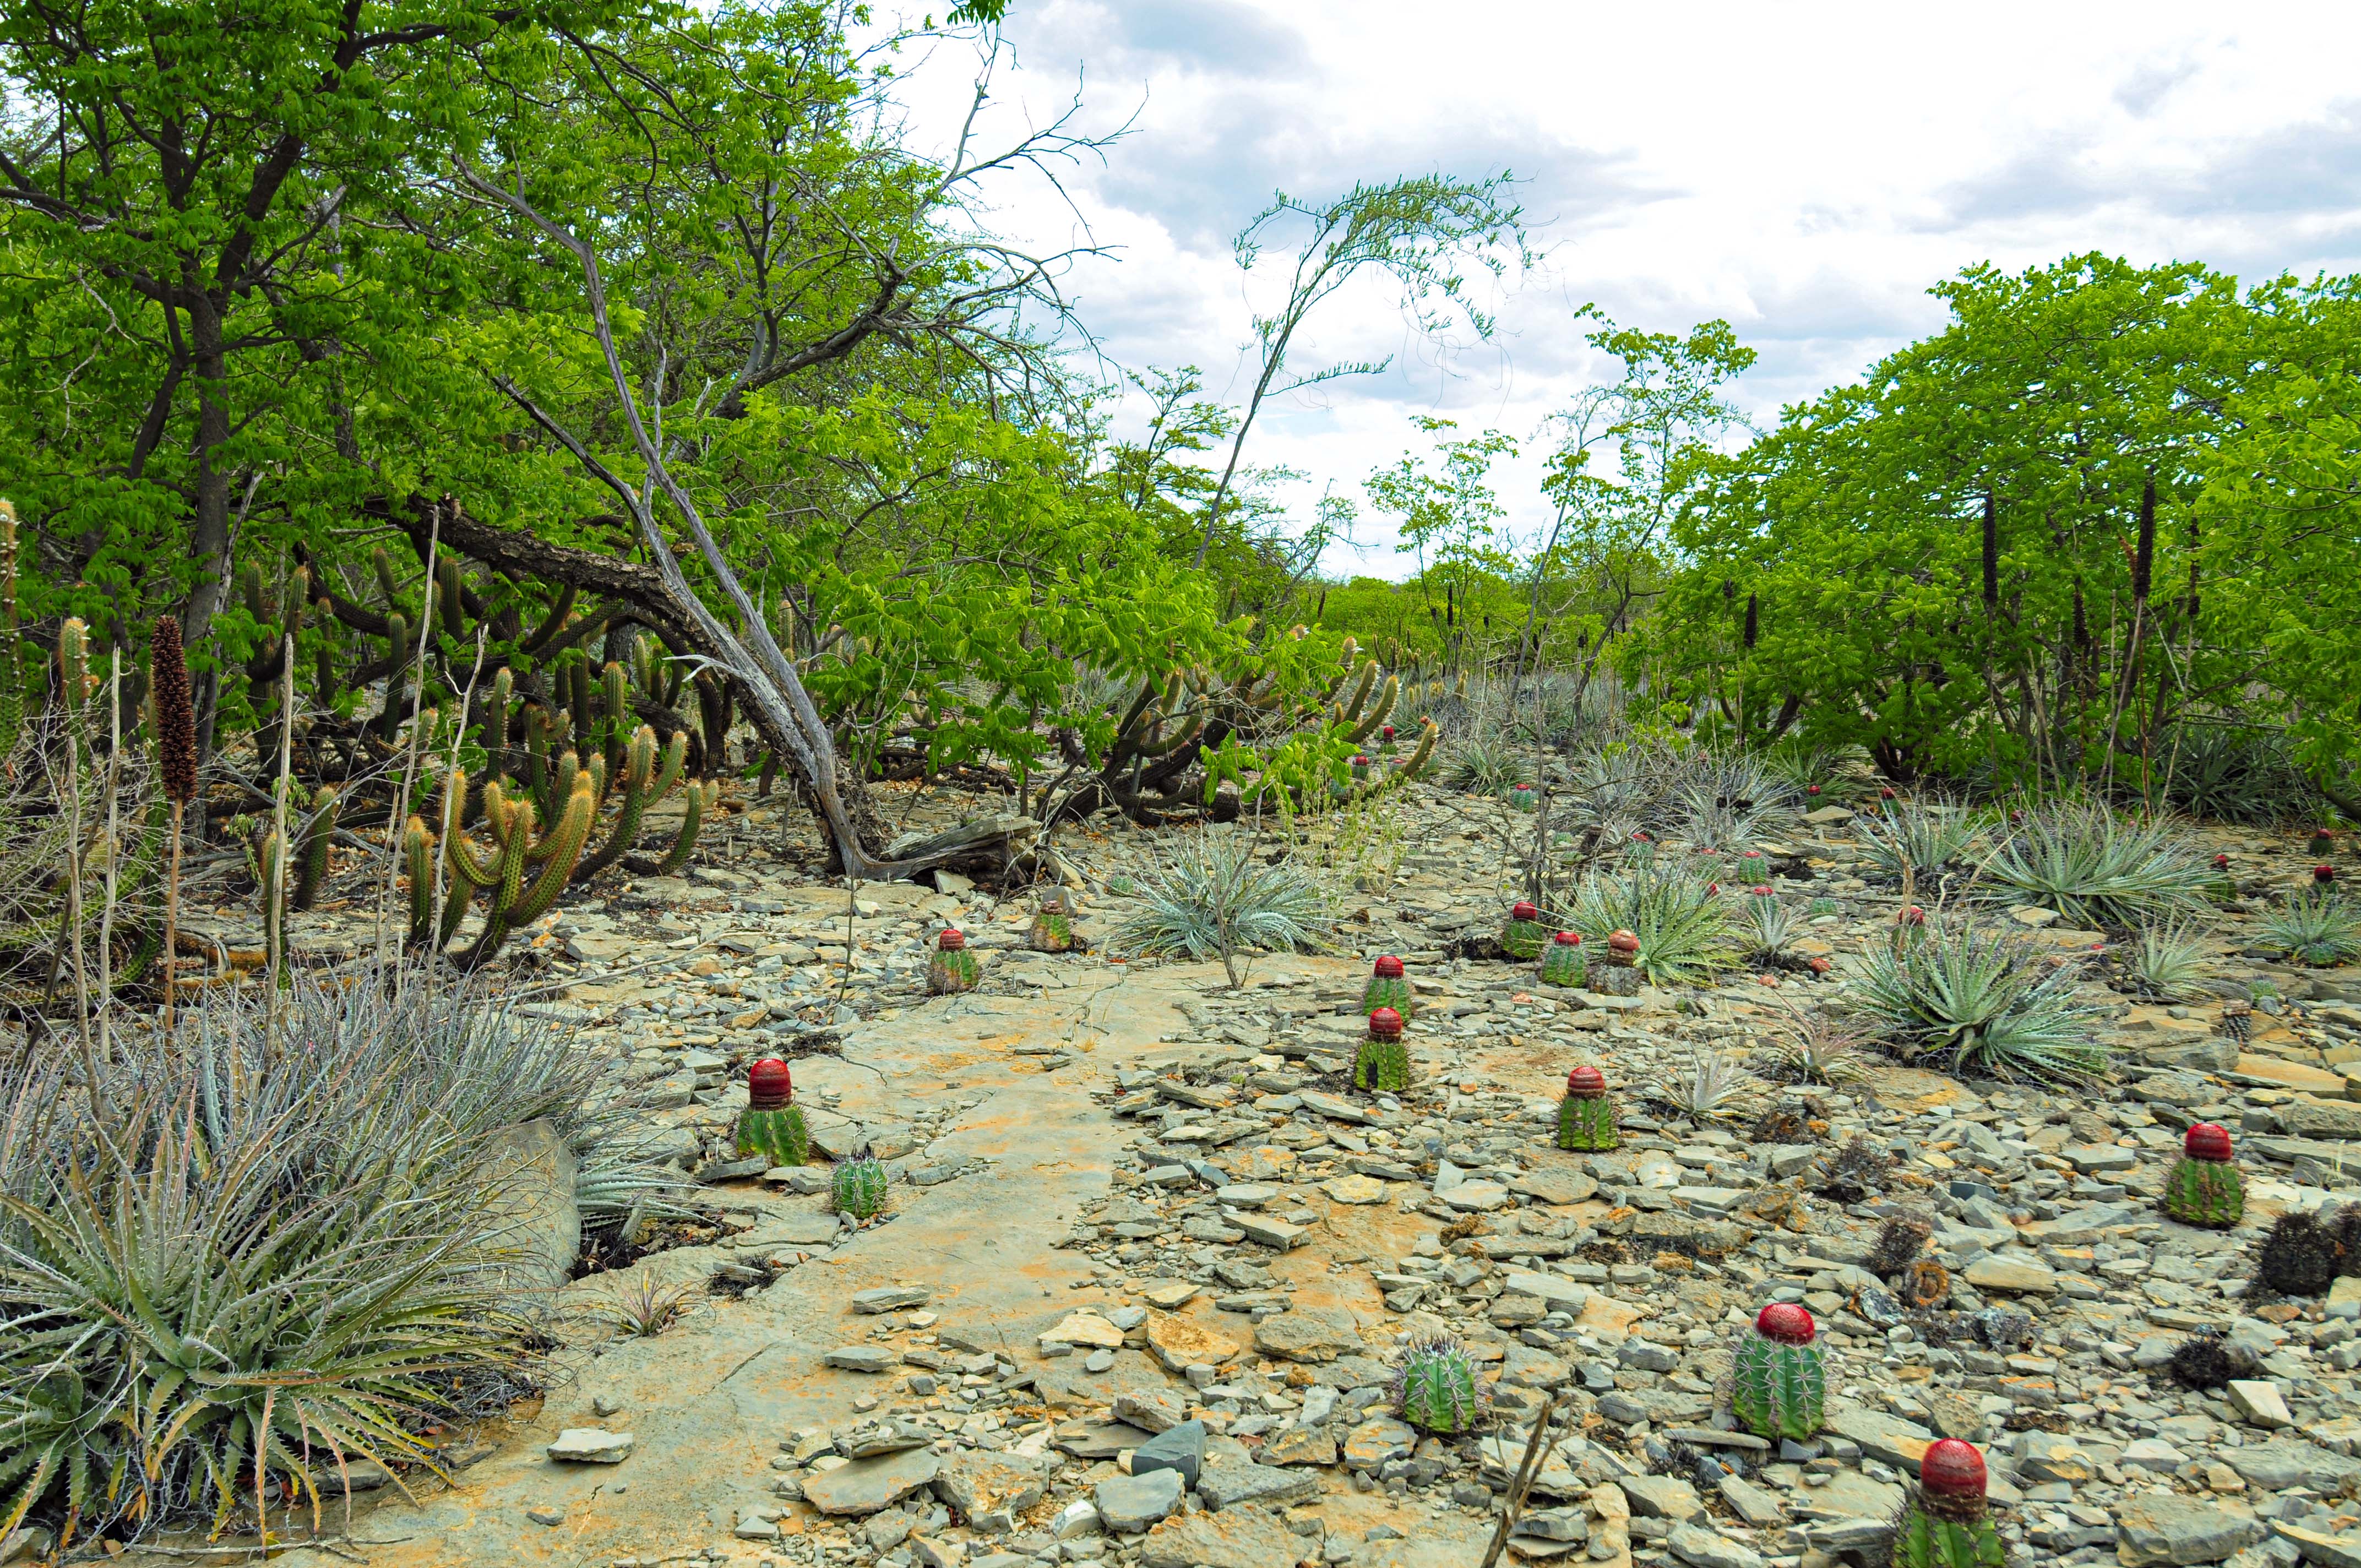
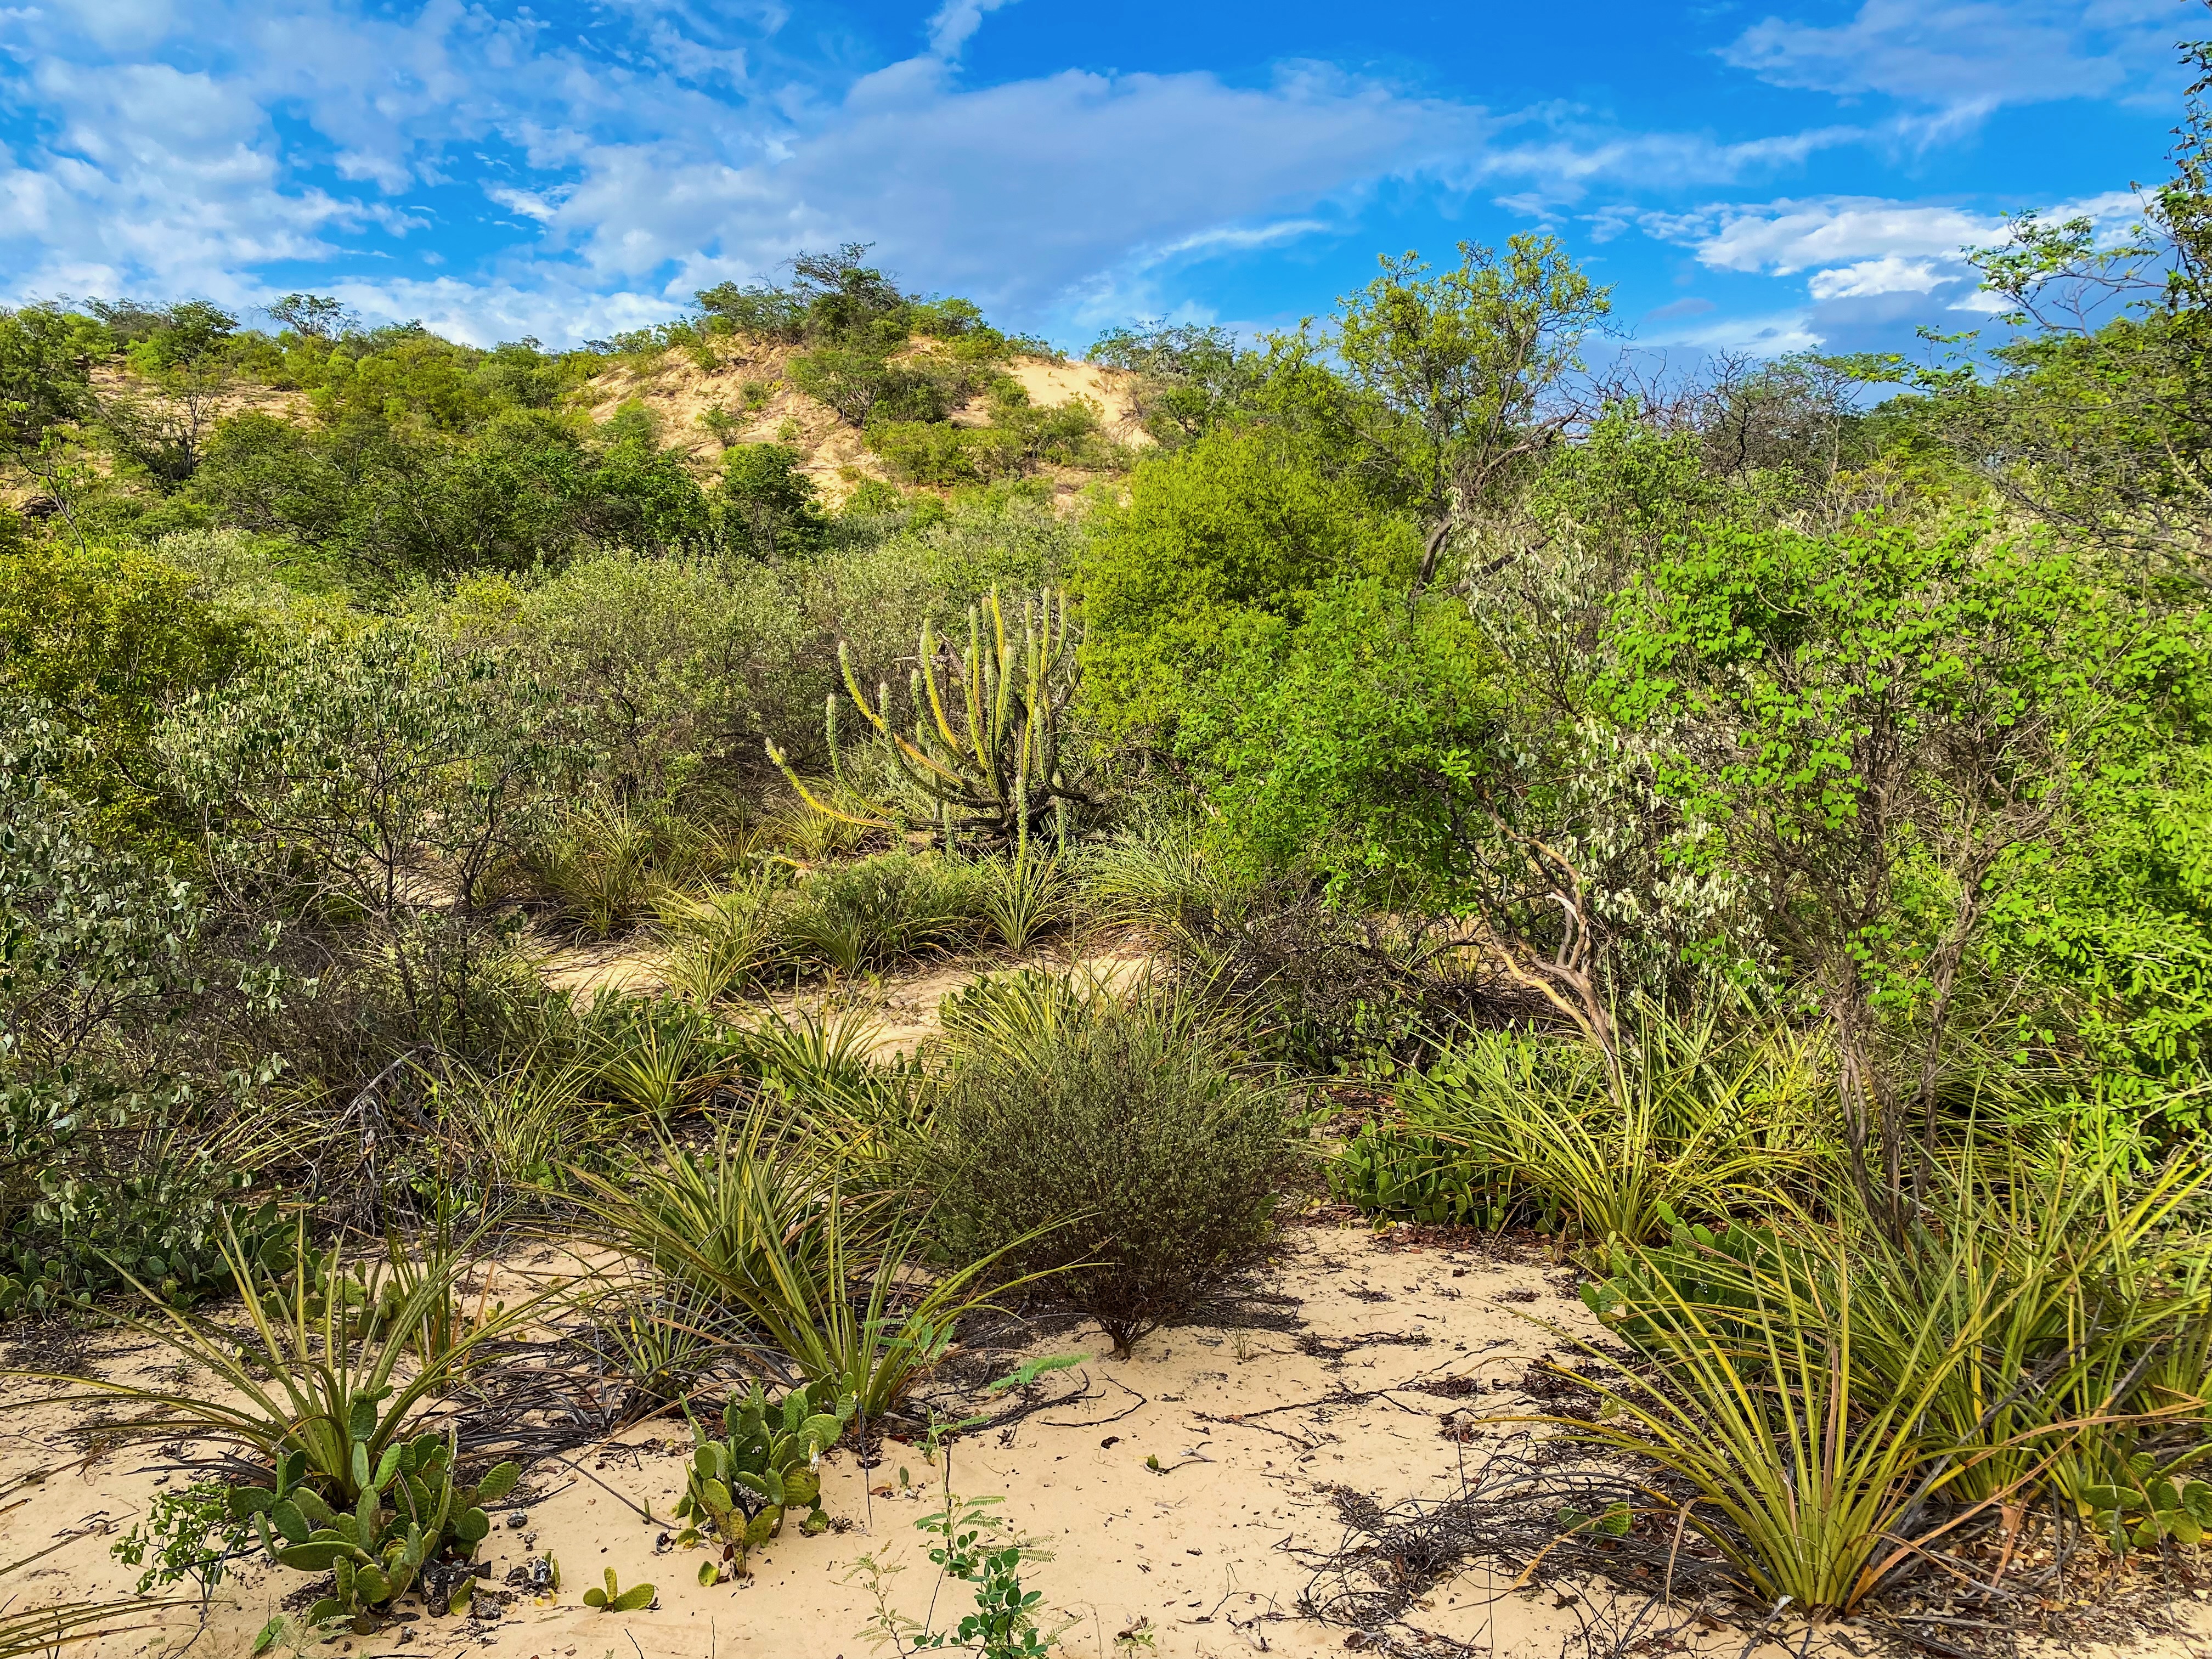
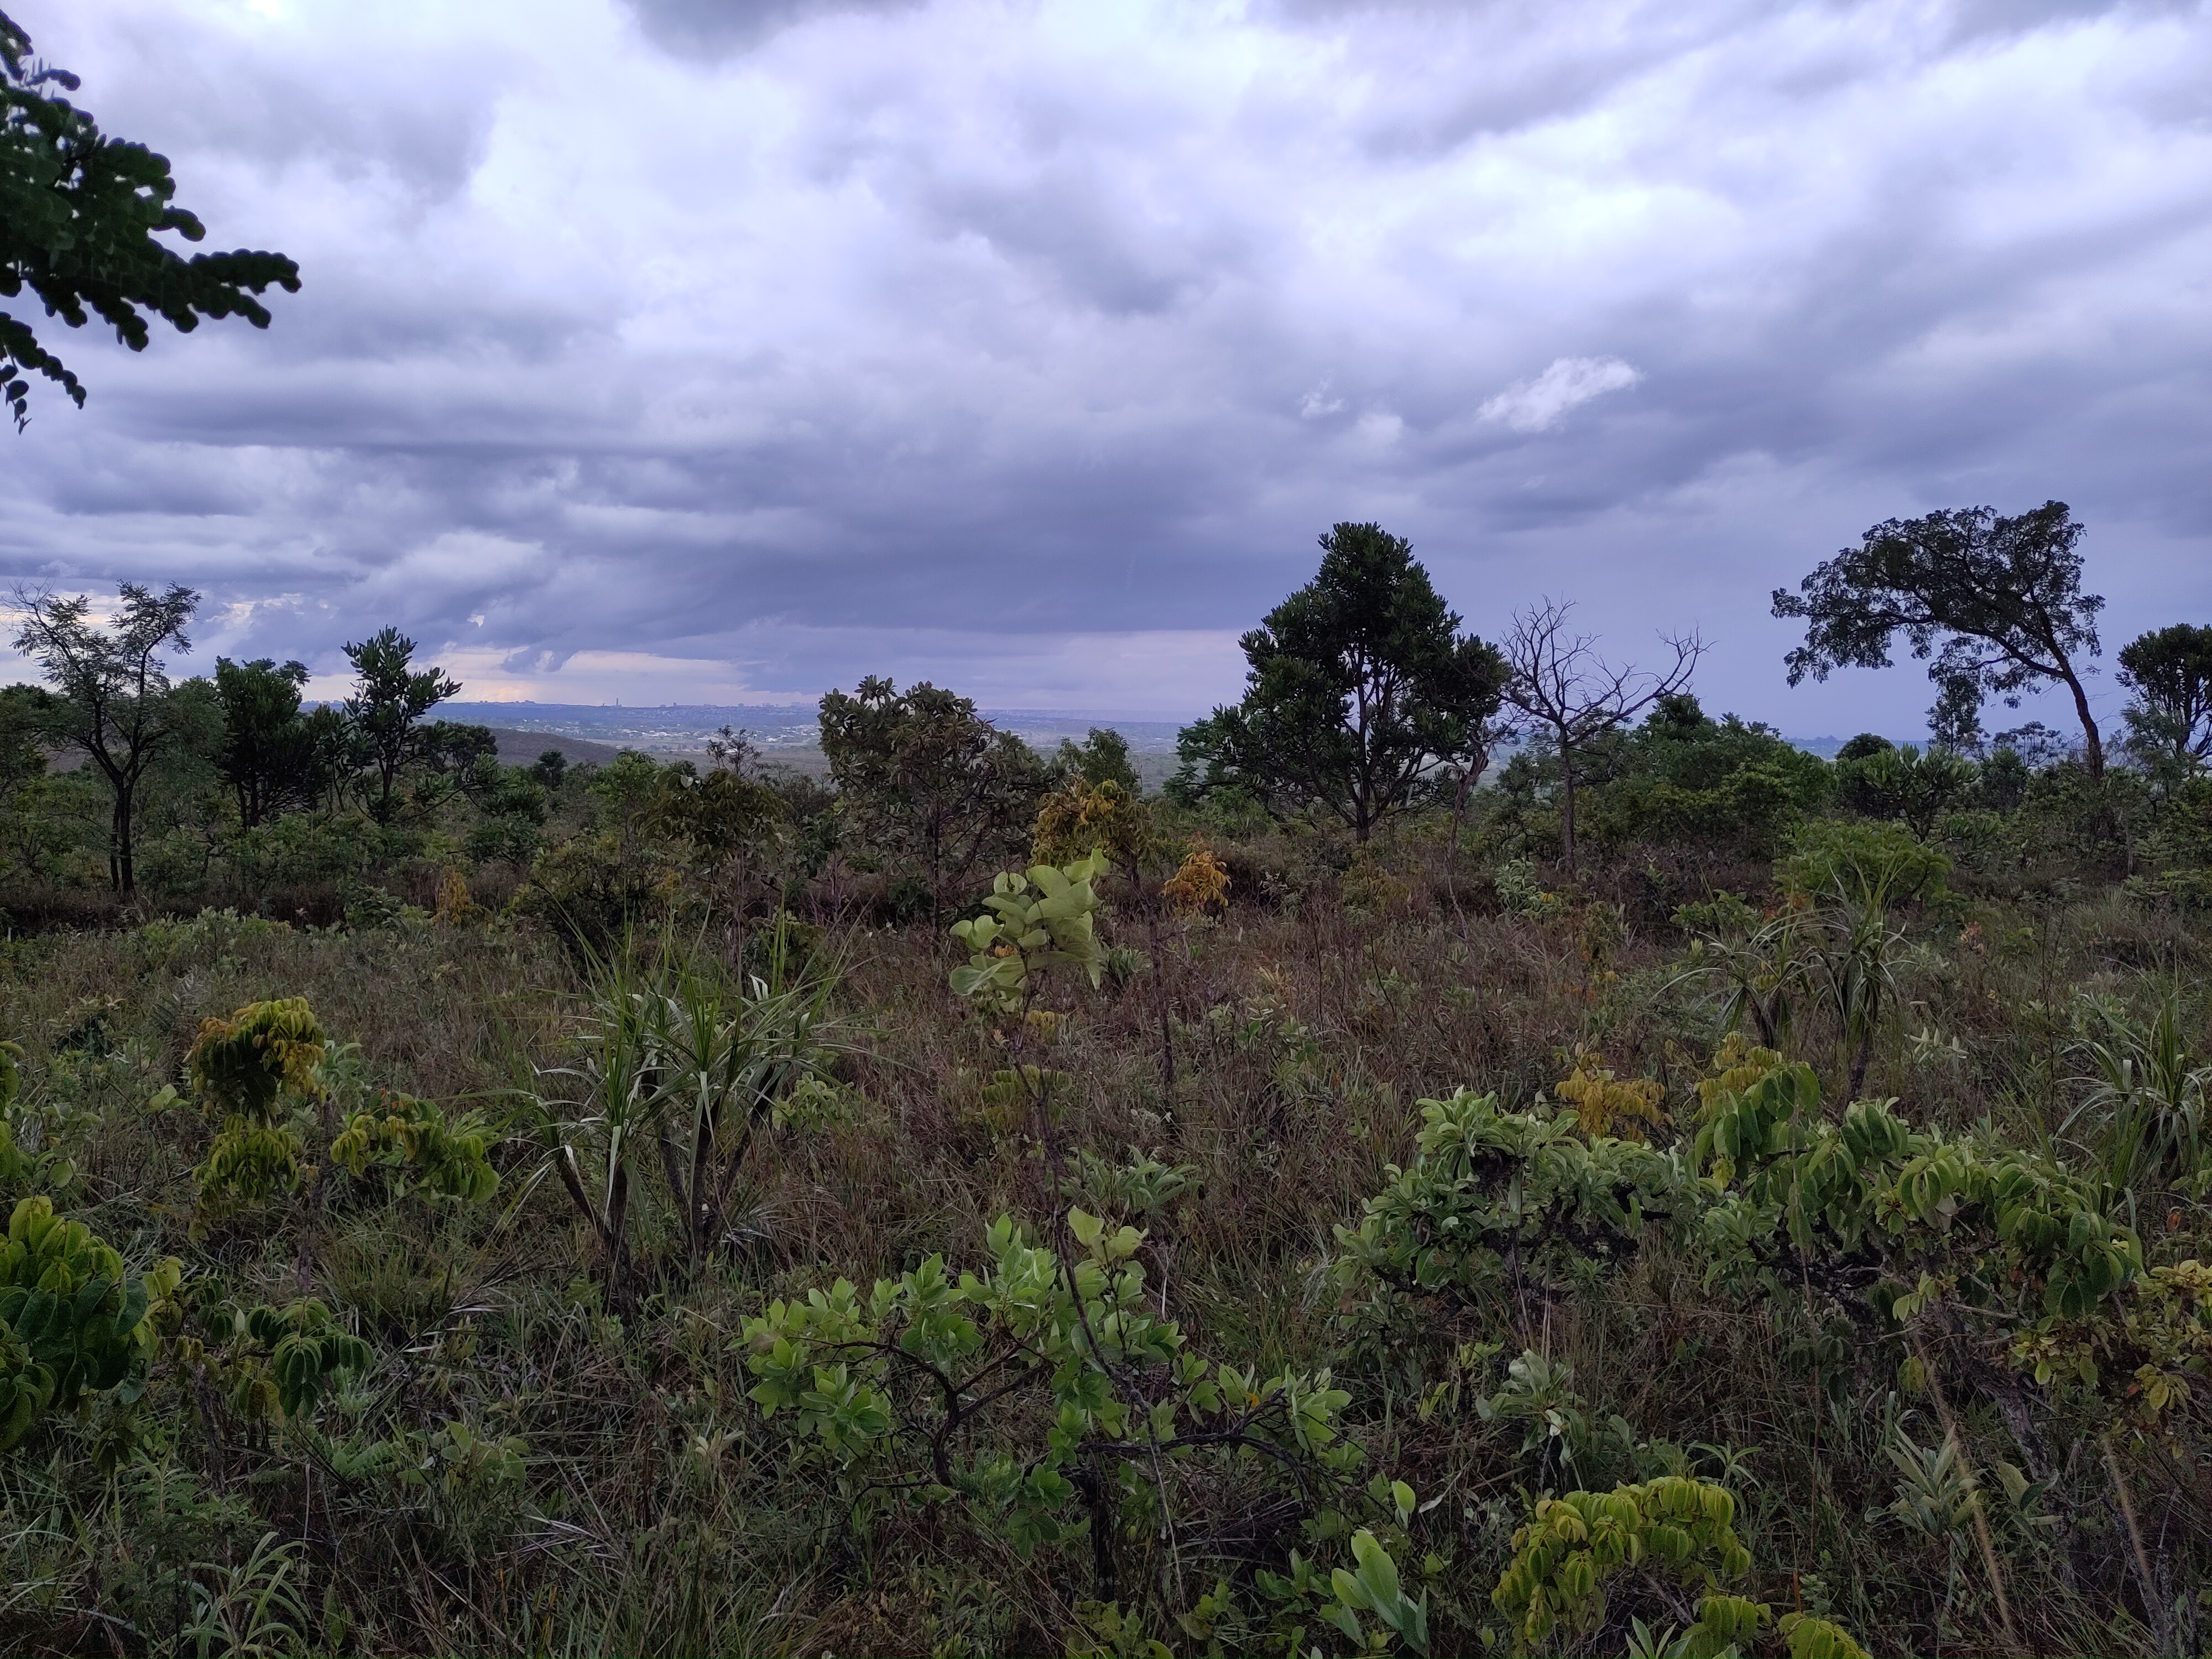
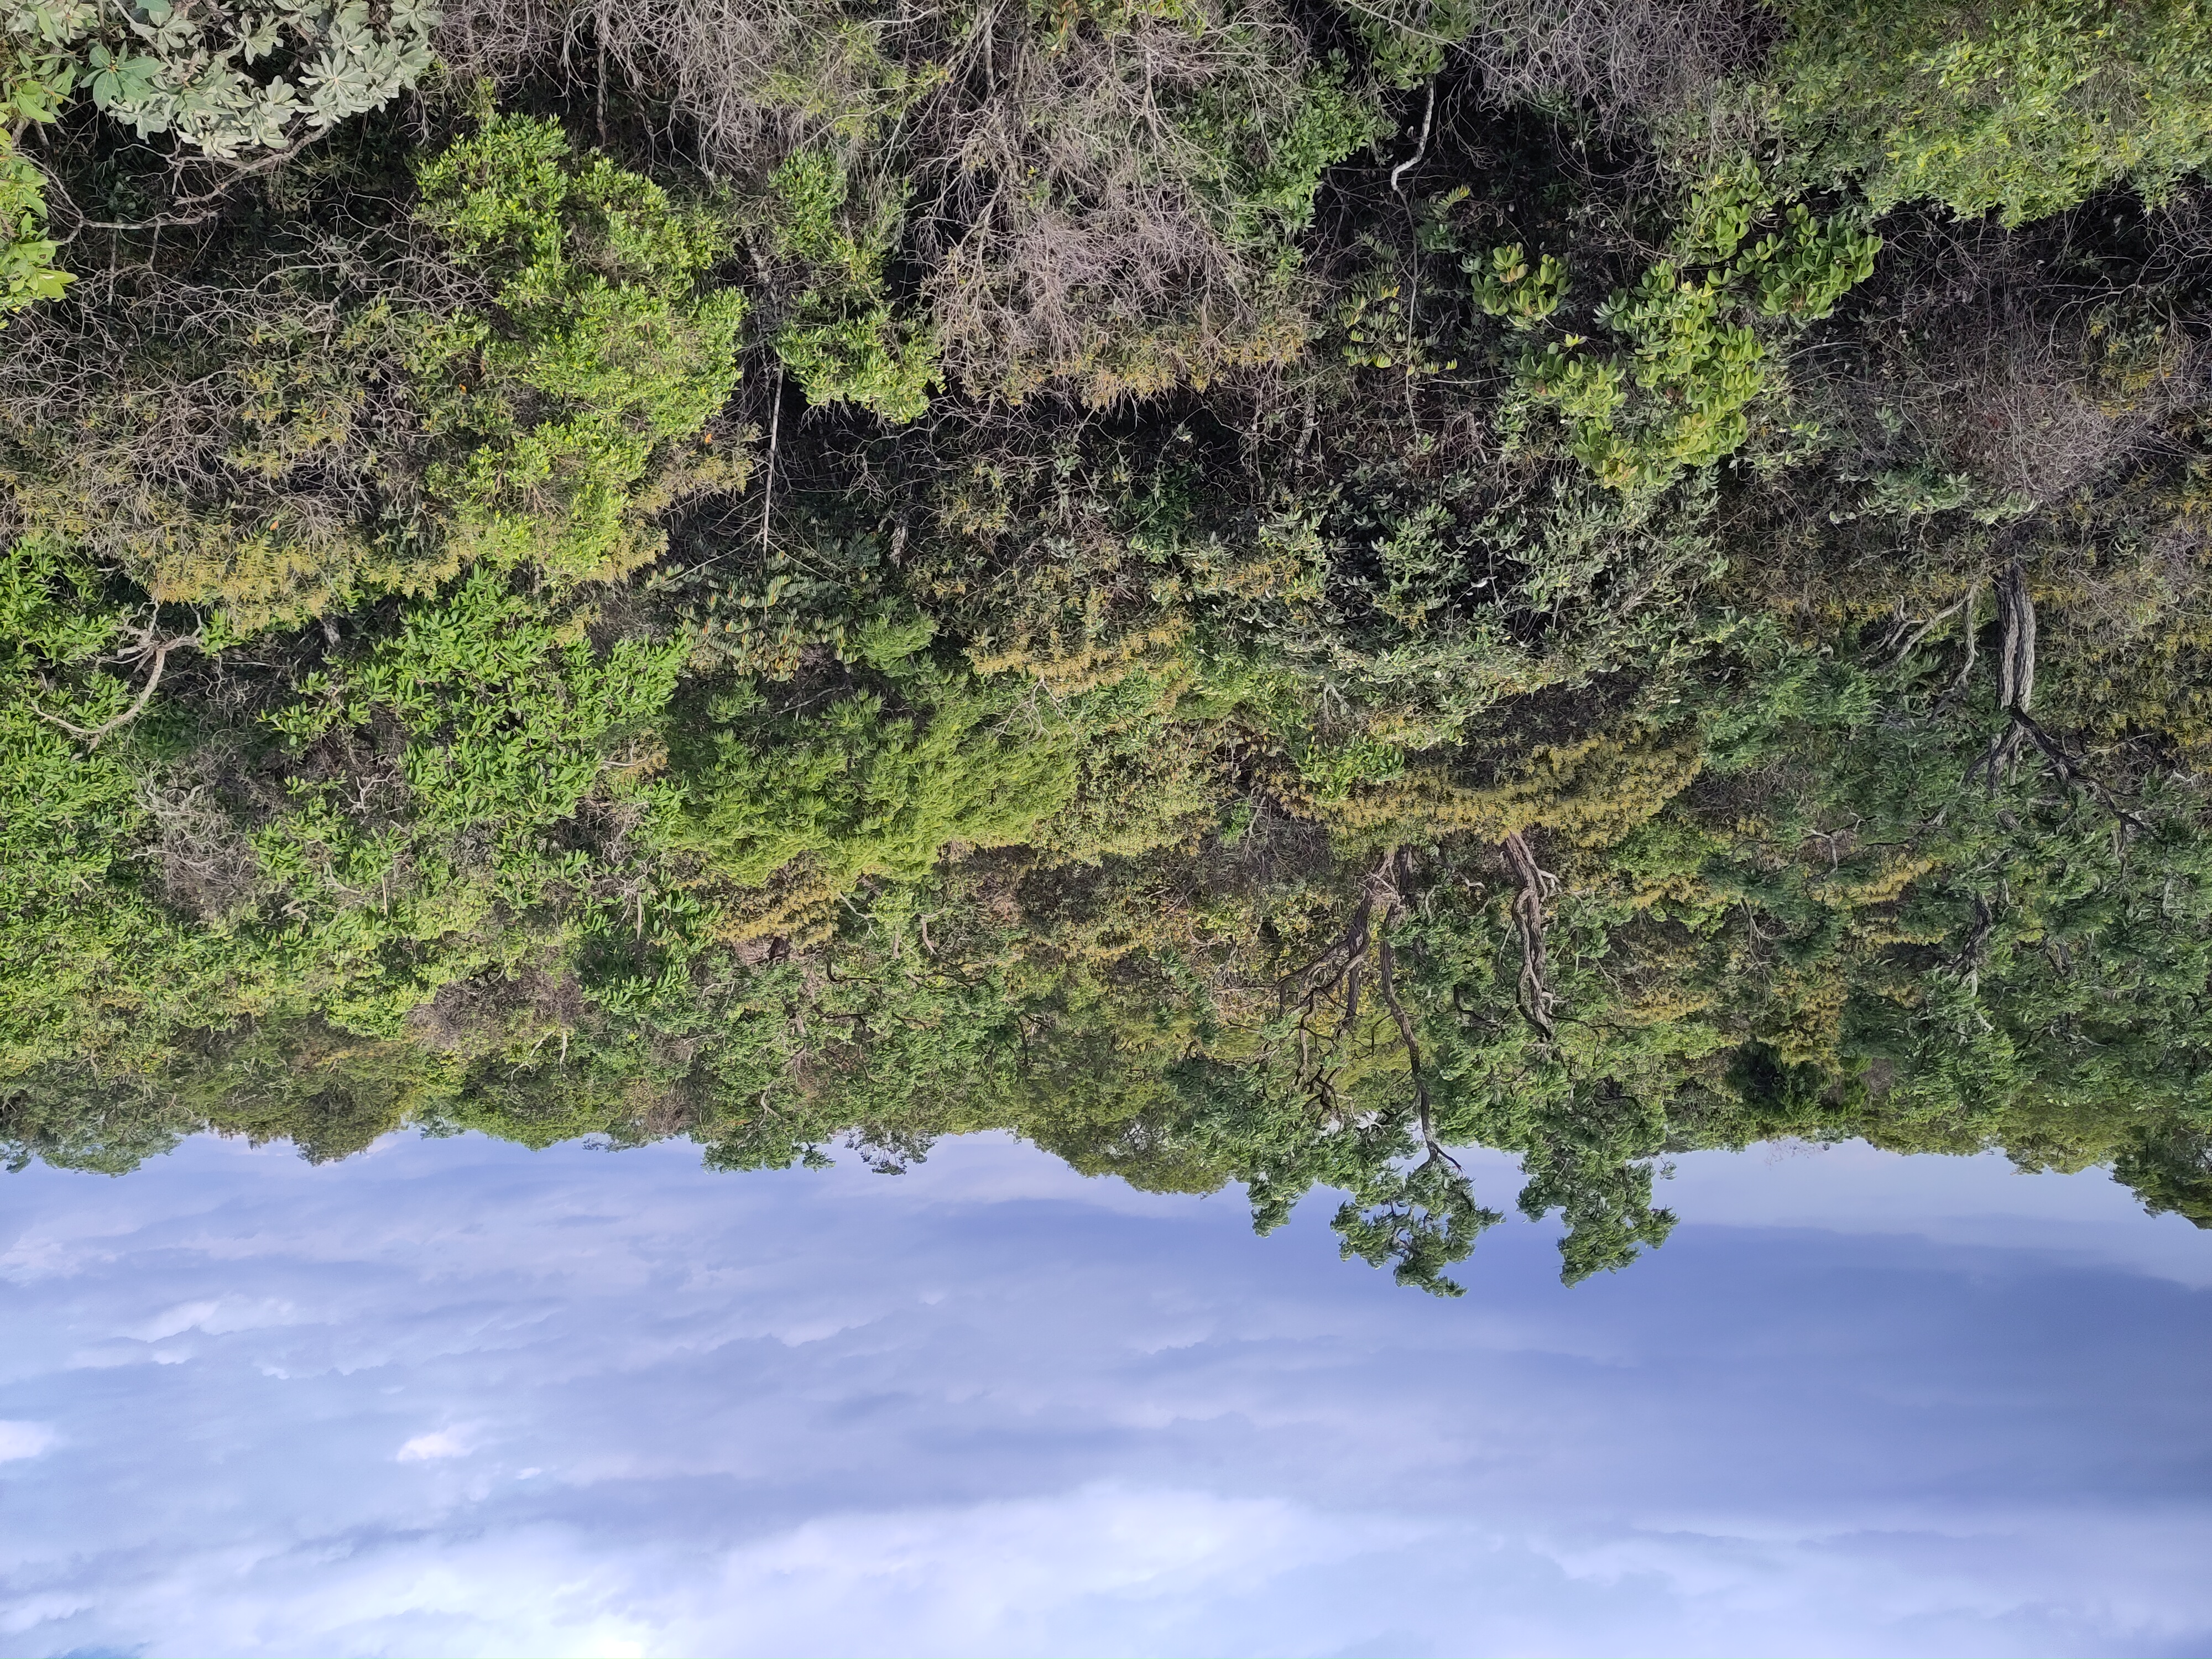
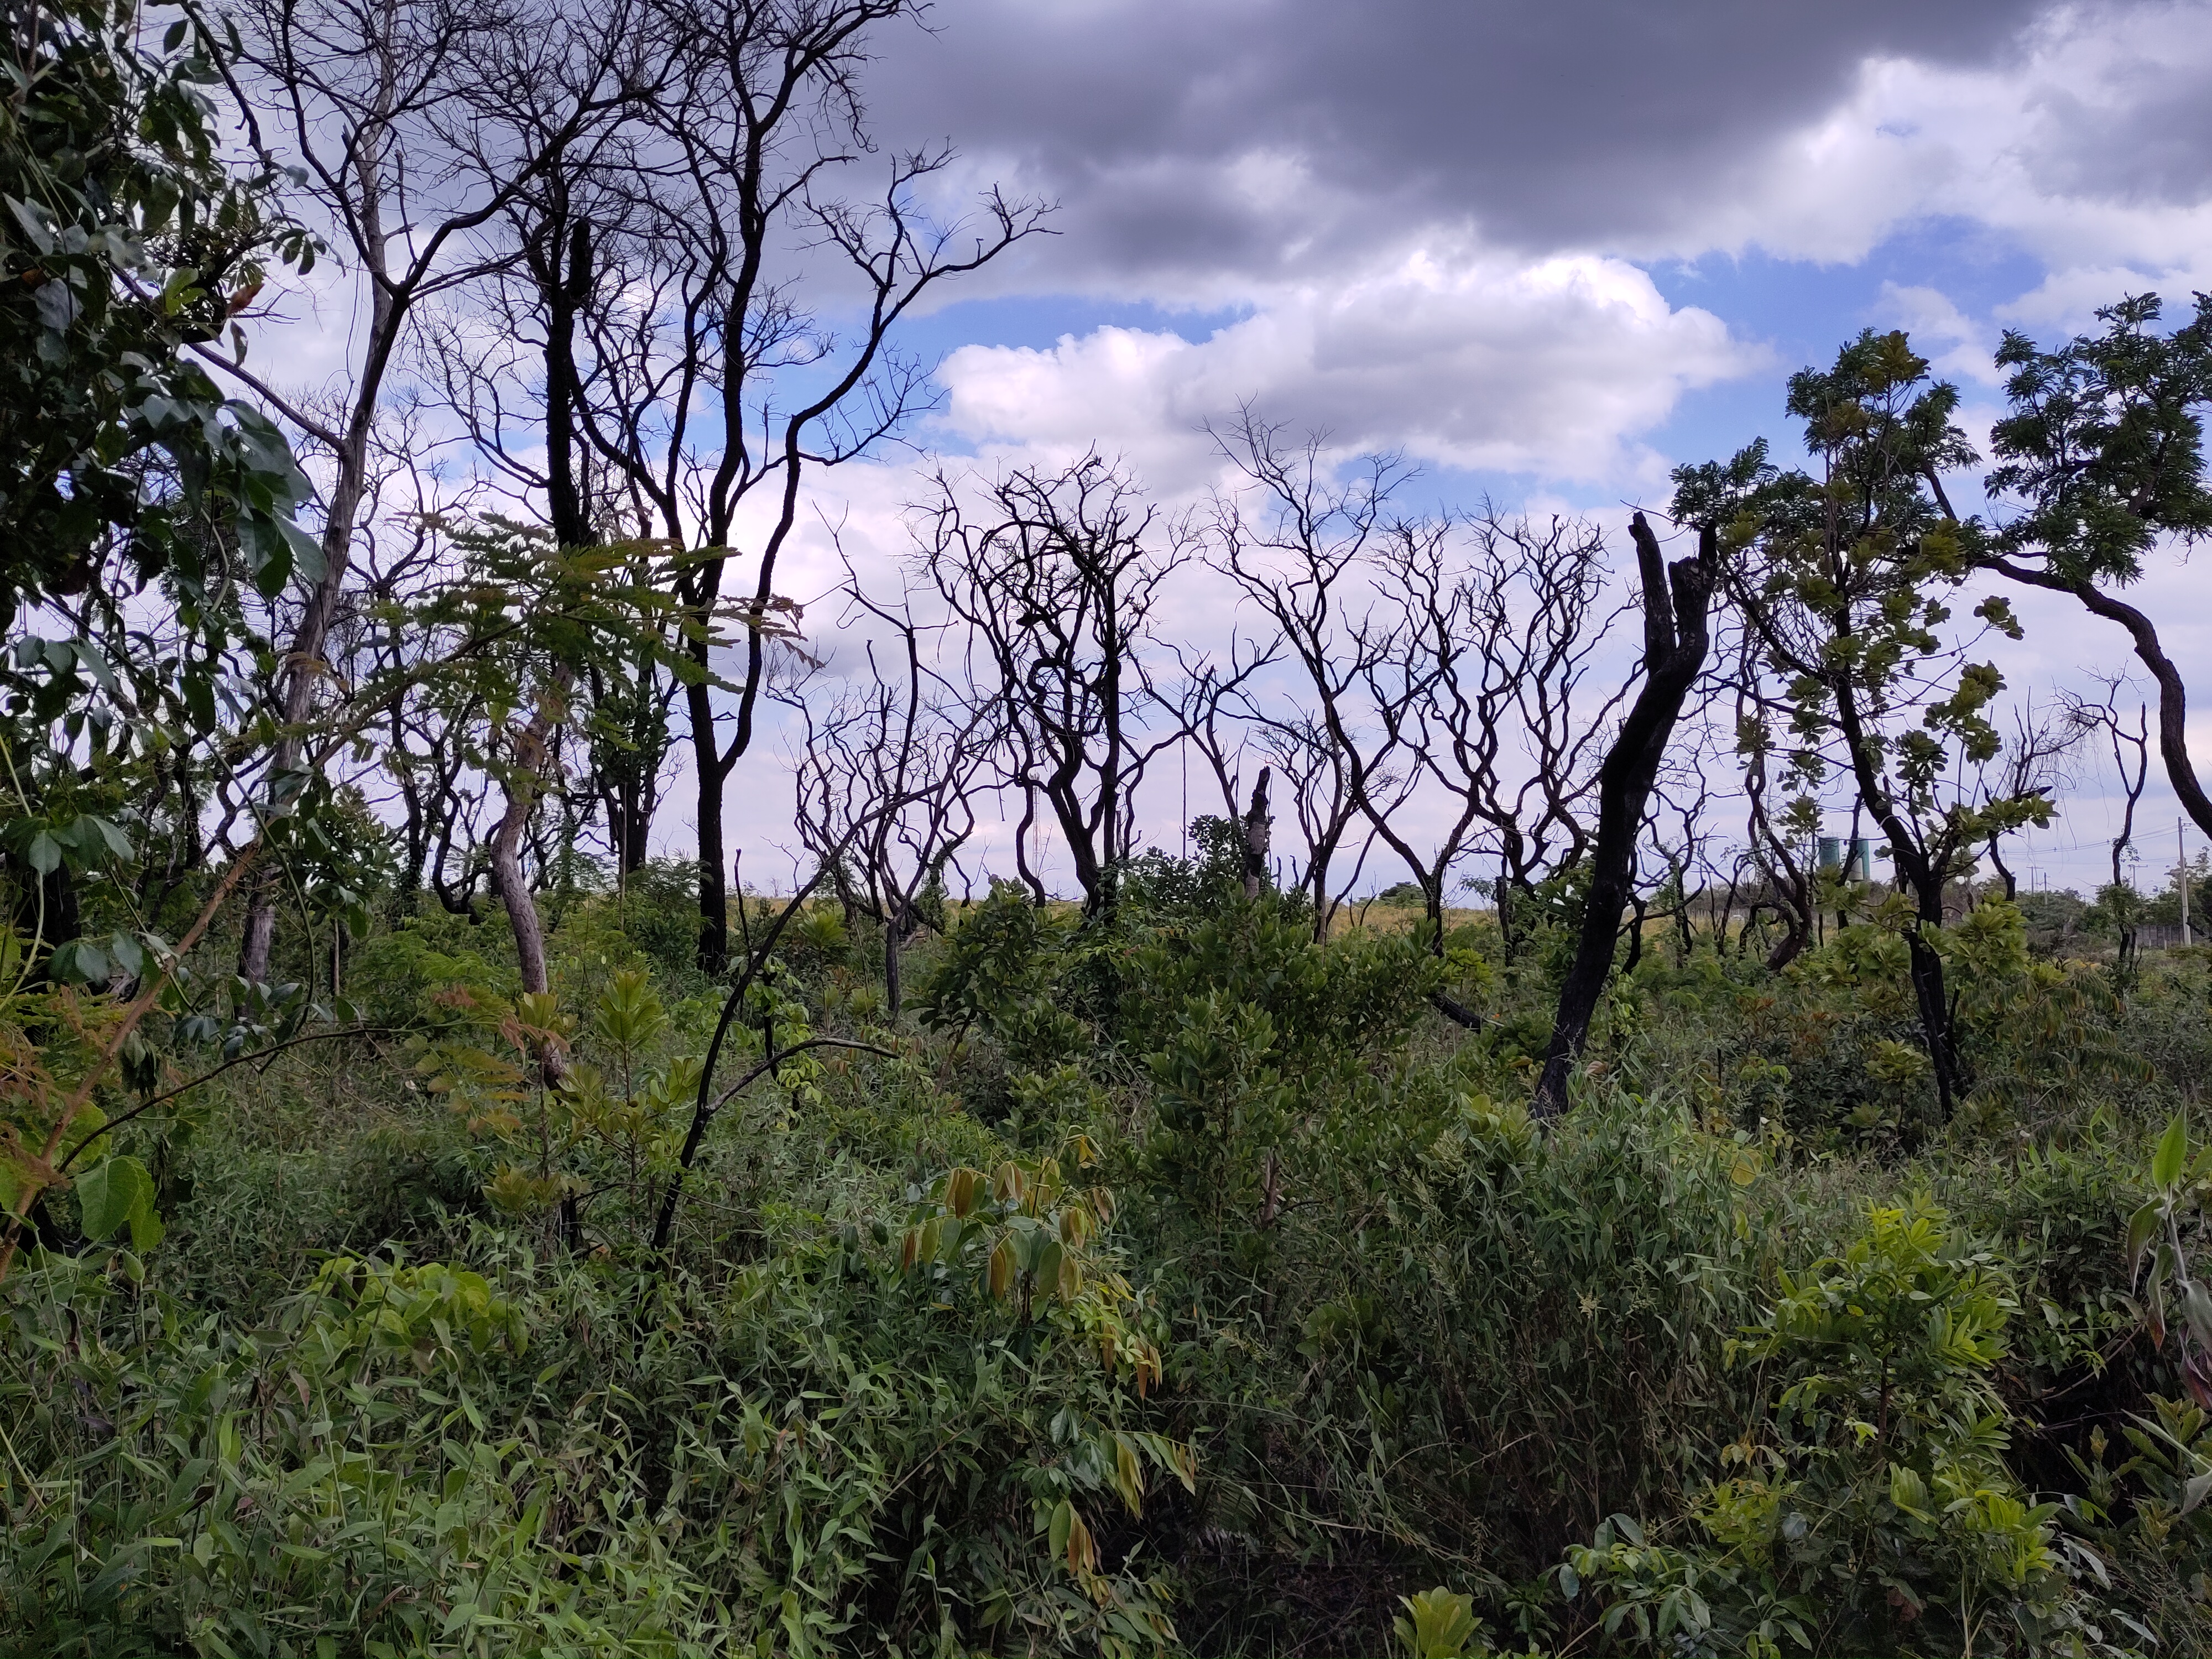
Field sites and environmental gradients connecting Caatinga and Cerrado vegetation across Rede C2.
Spatial structure
Rede C2 field sites represent local monitoring efforts distributed across seasonally dry ecosystems, linking permanent plots to vegetation type, landscape context, soils and climate.
The spatial organization of the network supports comparisons among Caatinga and Cerrado sites and helps interpret how plant communities vary across environmental gradients and through repeated censuses.
Interactive map
The map presents Rede C2 permanent plots with vegetation classification, plot area, census information and climatic or institutional metadata available in the project table.
Environmental context
Site-level information can be interpreted together with climate, soil, vegetation structure and landscape descriptors. Repeated censuses connect local dynamics with broader ecological patterns across dry forests and savannas.